← Back to Projects
Wellspring
LiveHealth, access and need, county by county. Wellspring puts chronic conditions, screenings and checkups, disability, coverage and the safety net on one clean map for six states, from the county down to the census tract. Every figure is a published area statistic, and the map says which are modelled.
Screenshots
What It Does
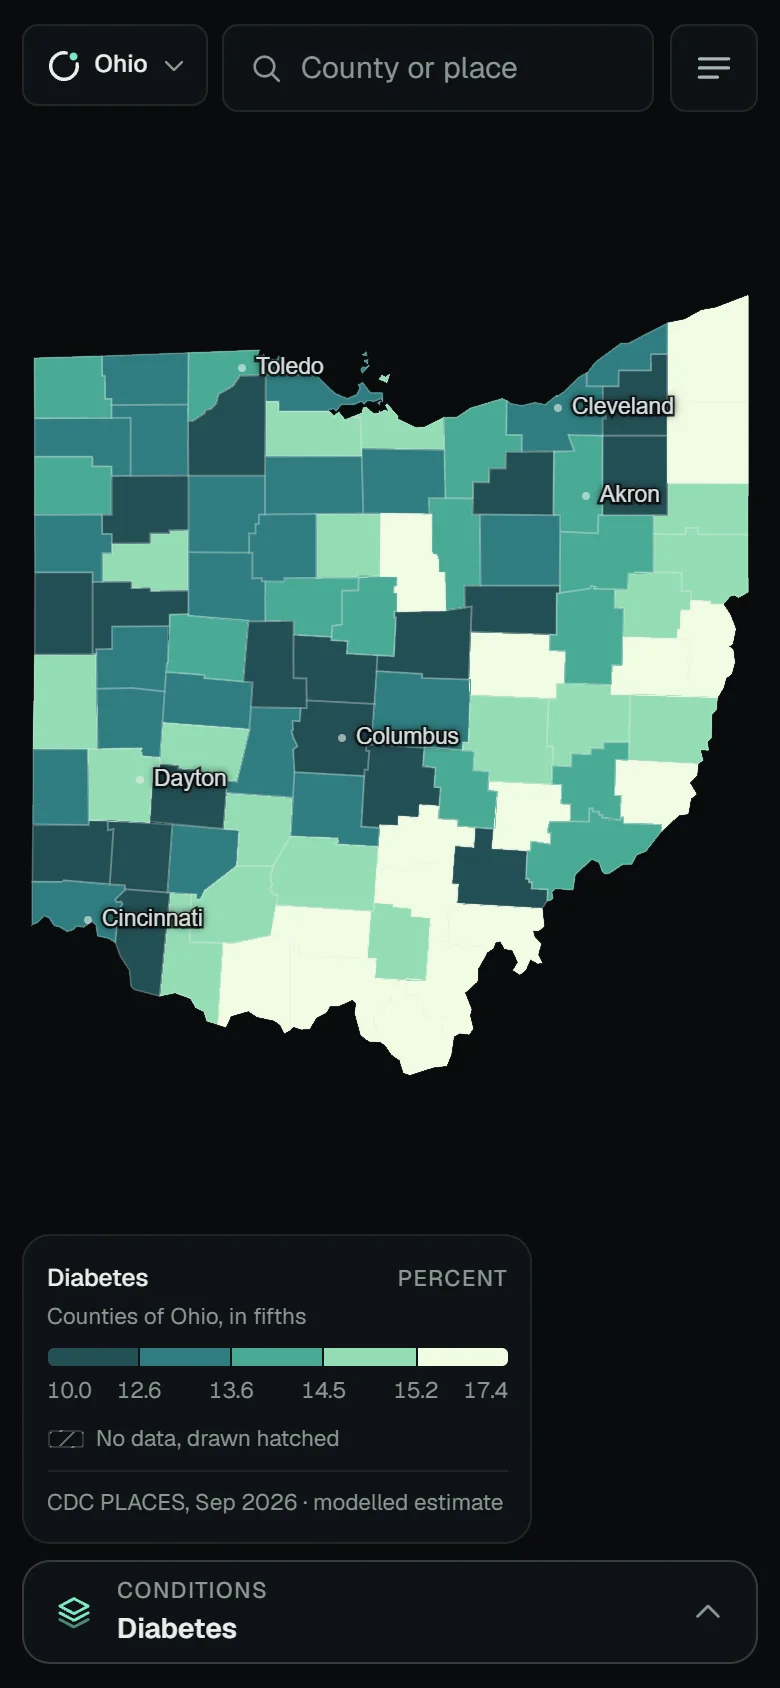
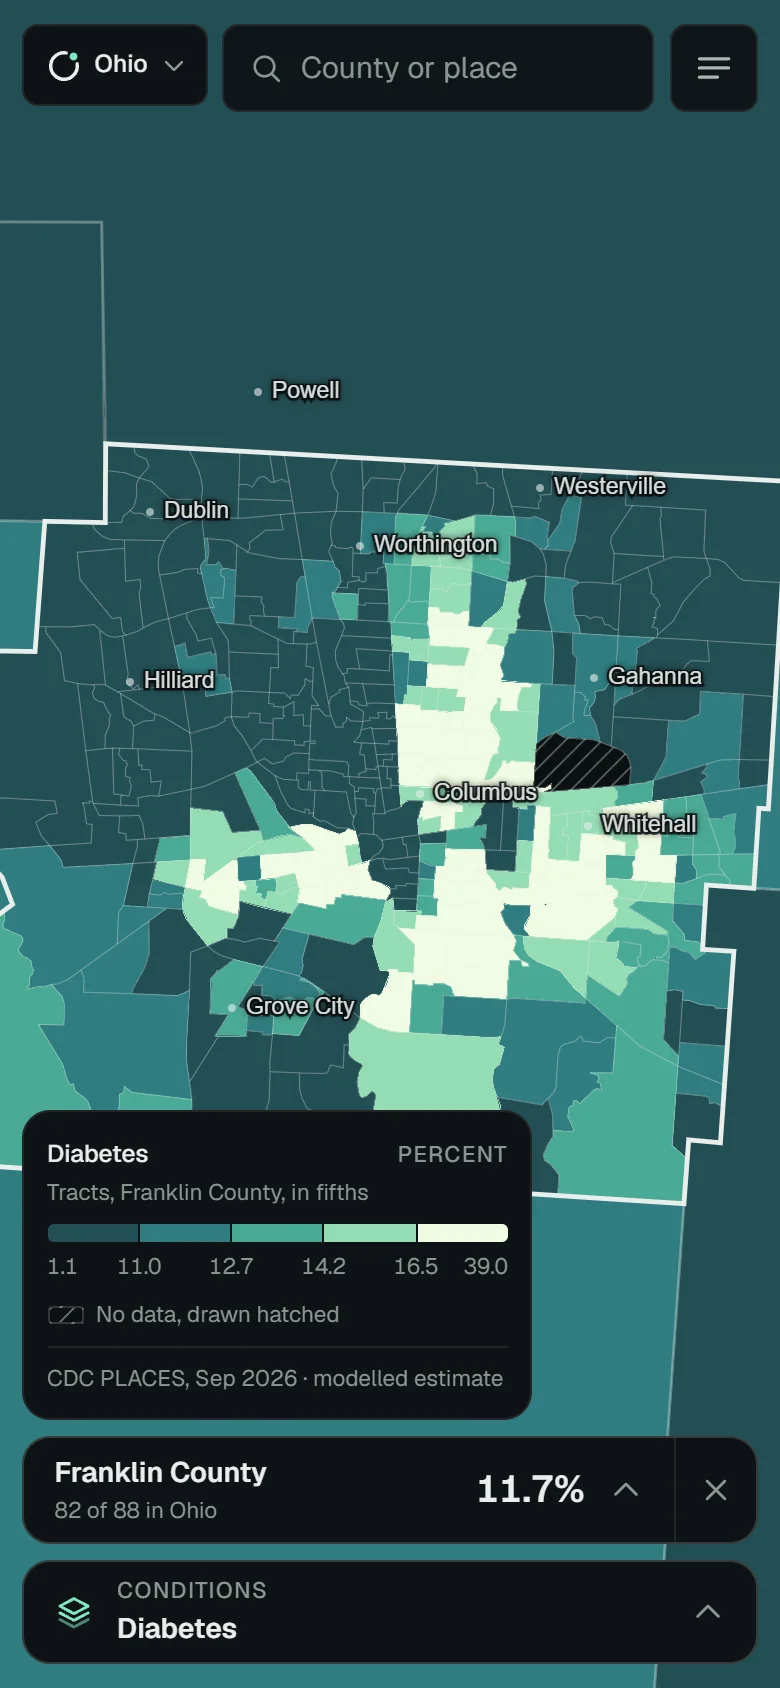
- →Maps 53 measures as county choropleths in quantile fifths, and drops to census tracts when you zoom into a county
- →Opens a county card led by one large number, with every measure’s rank in the state and a bar against the state range
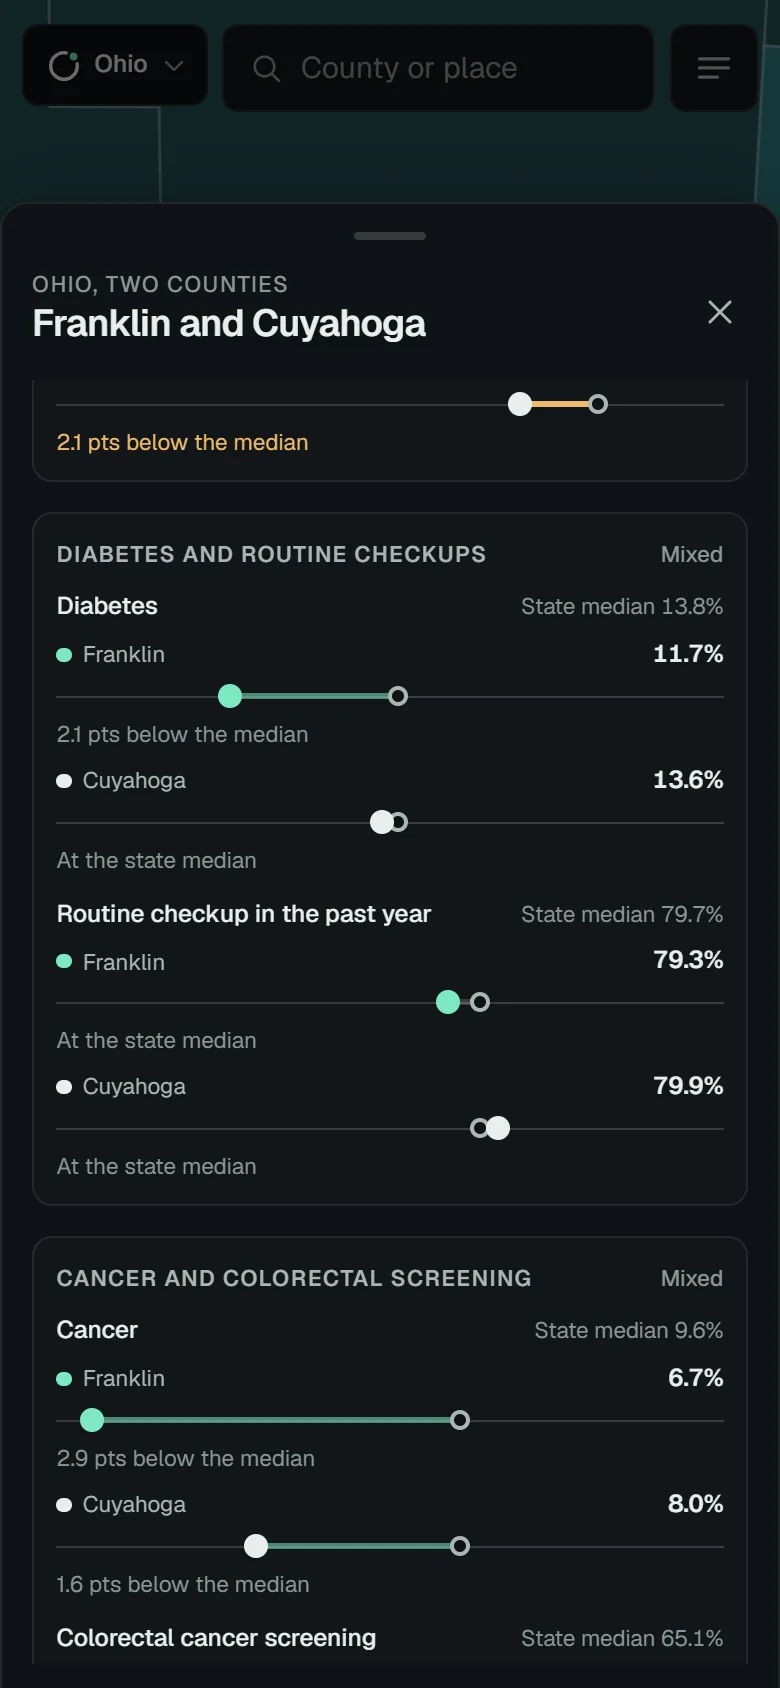
- →Sets a second county beside the first, each with its own colour and name in every row
- →Pairs each condition with its care measure against the state median in the Screening gap panel, drawn as dumbbells
- →Hides measures a state does not publish, and draws no data as a grey hatch, never as zero or a class
- →Reopens any exact view from a link, searches counties, places and topics, moves through counties with the arrow keys, and works offline for the states you have opened
What I Built
- →A static, installable React, TypeScript and Vite app; the map is MapLibre GL on the owner’s own polygons, with no basemap, tiles, keys or backend
- →A Node bake script reads the Explorer data on disk and writes static JSON with a manifest of every input and its vintage; new CDC PLACES county values are adult-weighted roll-ups of tract values
- →A choropleth ramp tuned in CIELAB with colour-blindness simulations, and a grey hatch that is never read as a class
- →Strict URL-hash parsing, shape-checked data files, a locked-down content security policy, and a bounded service-worker cache
- →Sheets with snap points, trapped and returned focus, live-region announcements and a keyboard path through the counties; axe at 0 violations and Lighthouse accessibility 100
- →Self-hosted Geist type with tabular numerals, styles for reduced motion, forced colours and higher contrast; 108 tests