← Back to Projects
Granary
LiveWhere retirement money rests. Granary maps income per tax return, pensions and IRA distributions, Social Security and home equity across six states, county by county and tract by tract, set like a ledger rather than a bank ad. An affluence-tier view sorts every neighbourhood into Core, Affluent and Premier, and says plainly that it is an area estimate.
Screenshots
What It Does
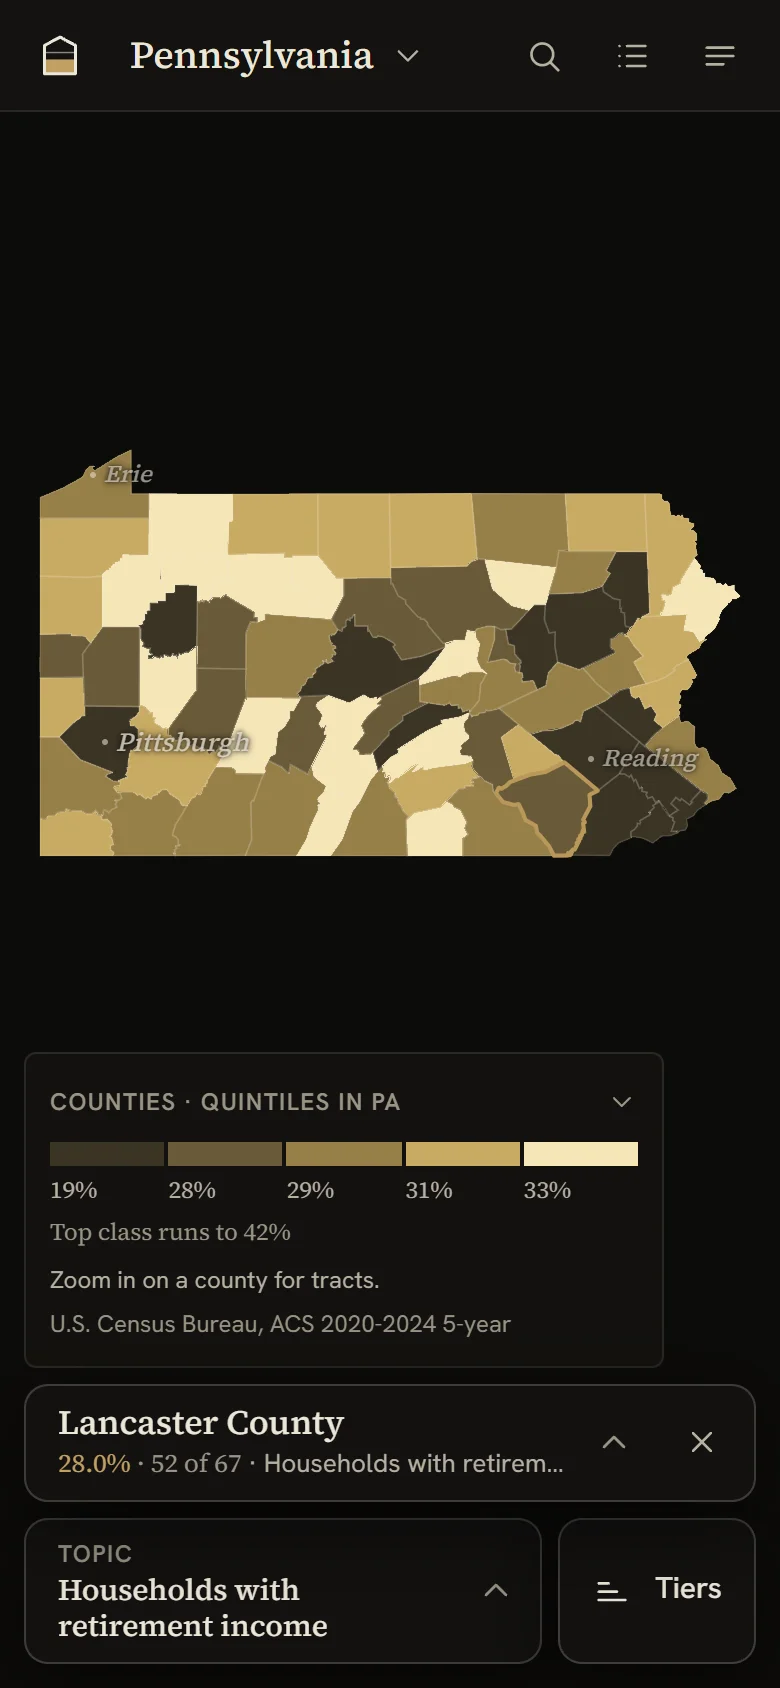
- →Shades every county by 26 published statistics, in quintiles of its own state, and drops to census tracts when you zoom into a county
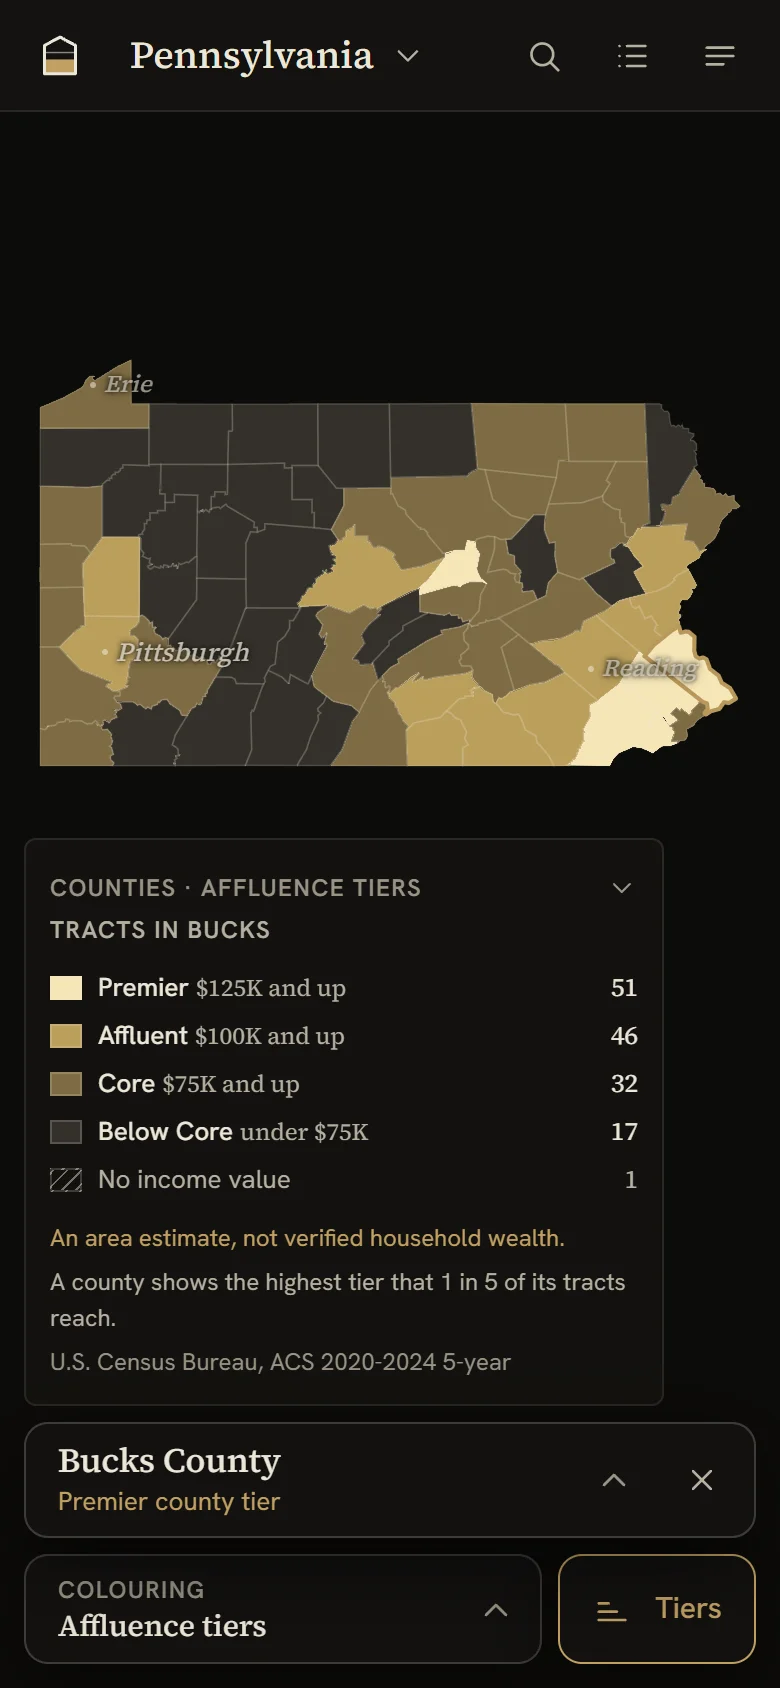
- →Affluence tiers sort every tract into Core, Affluent and Premier by median income, with the area-estimate caveat built into the design rather than tacked on
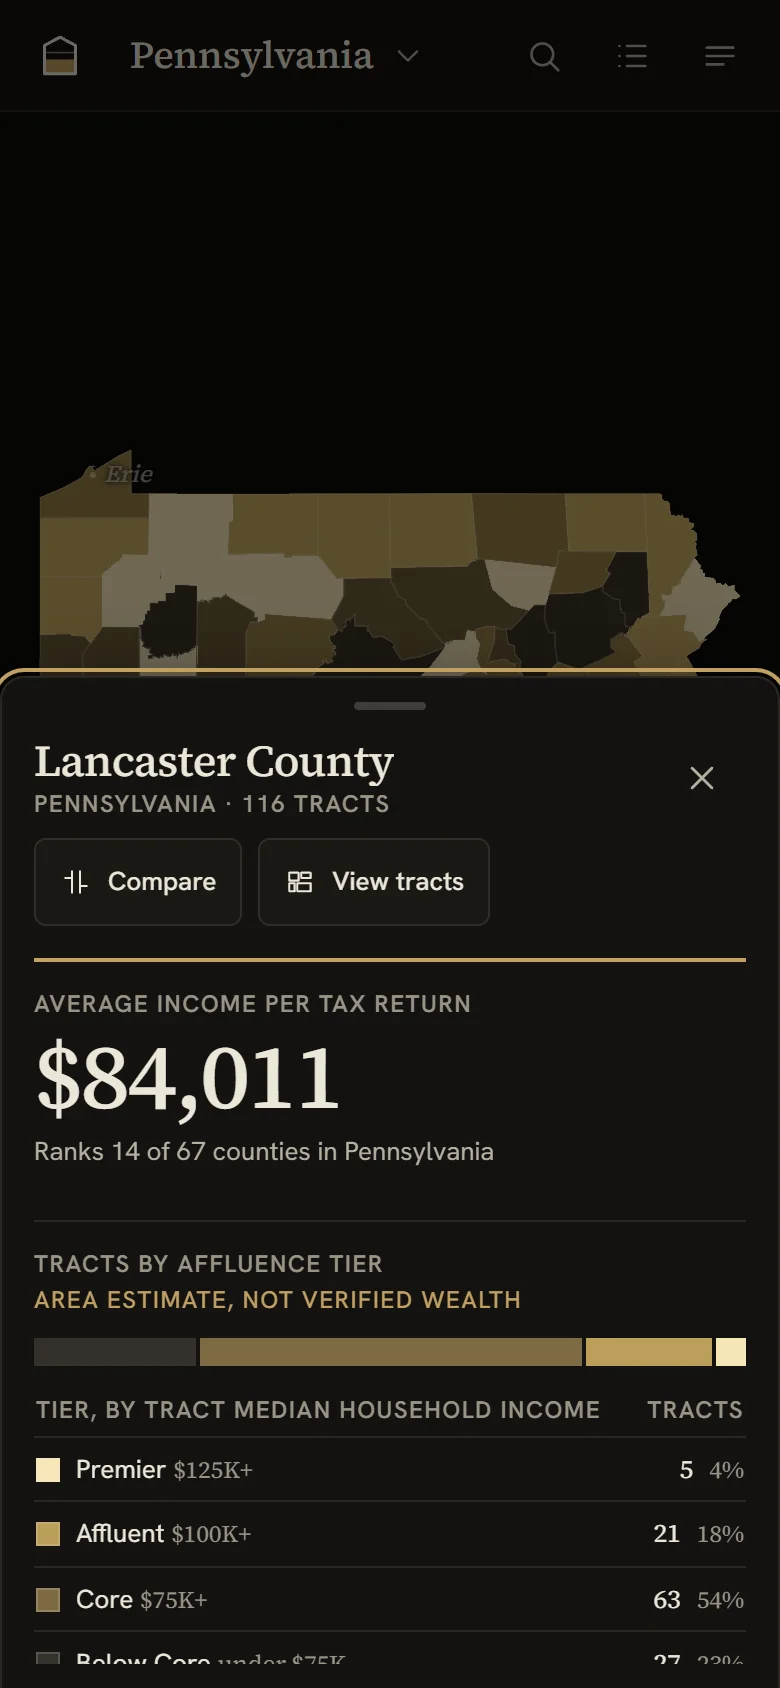
- →A county card puts one hero figure first, with rank, a bar over the state range, tract counts per tier and a side-by-side compare
- →Works by keyboard or from a ranked county list, with search across six states and links that reopen the exact view
- →Shows IRS figures at county level and Census figures down to the tract, and says which is which in the legend
- →Installable, offline once a state has been opened, with no accounts and no tracking
What I Built
- →Vite, React, TypeScript, Tailwind, zustand and MapLibre GL, with no tiles, keys or backend
- →County and tract polygons baked from the owner’s Explorer data by a deterministic script that refuses a changed source header, with quantile breaks computed at bake
- →Source Serif 4 and Hanken Grotesk self-hosted, sized in rem so the whole interface scales with text size
- →A colour ramp validated against three colour-blind simulations in a test, and a hatch pattern no class can be mistaken for
- →Snap-point sheets with held focus and an inert background, a keyboard path through the counties, axe clean on every screen
- →A strict content security policy, shape-checked data files, versioned storage, a bounded service-worker cache and 239 tests