← Back to Projects
TheWoob Explorer
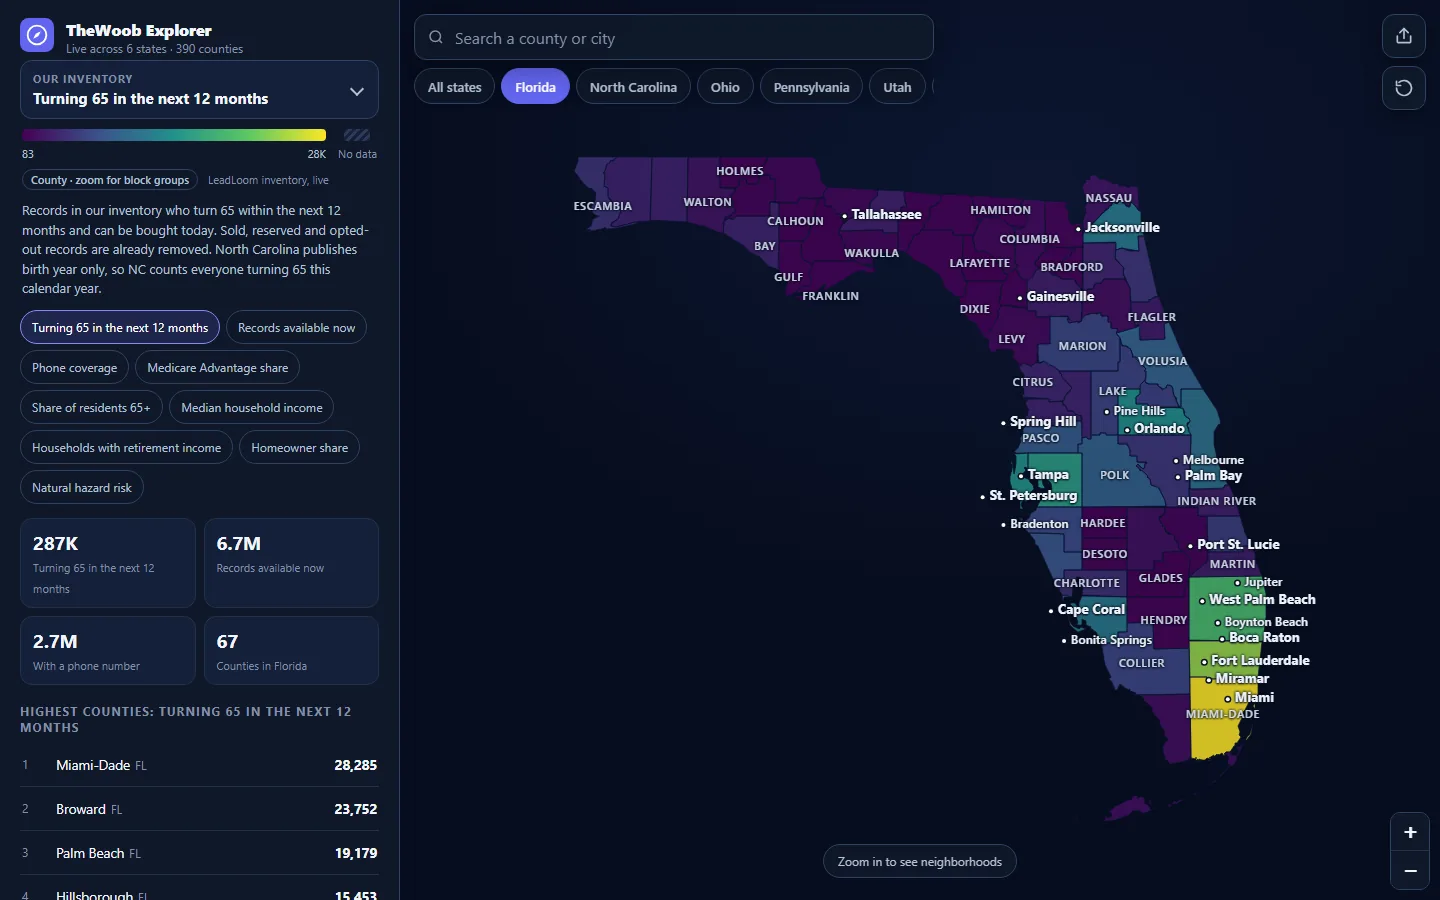
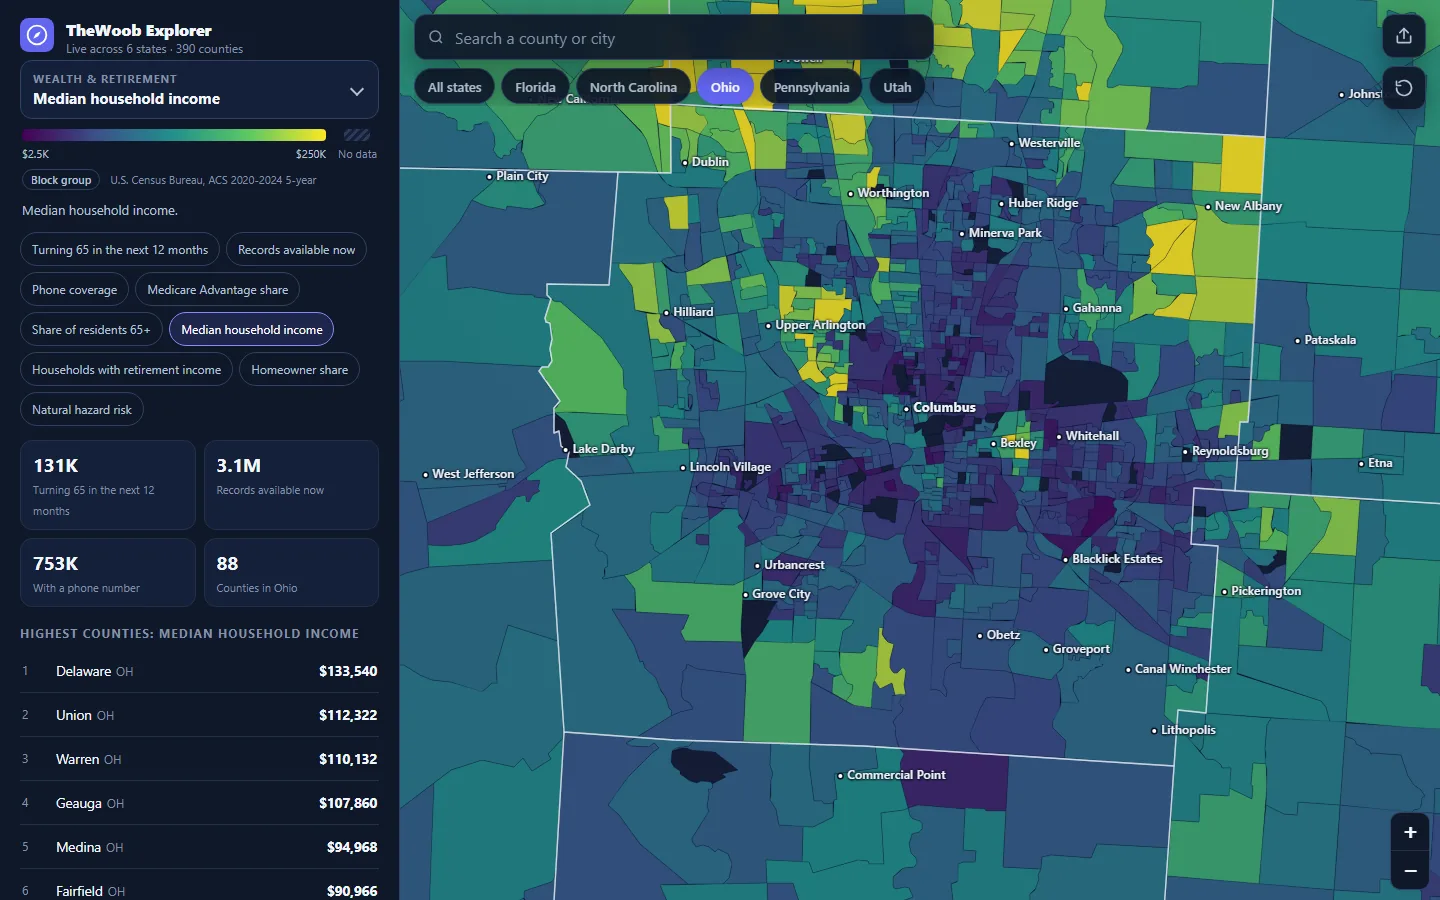
LiveA free, public map of Medicare, senior, wealth, housing, health, and natural-hazard data across six states. Zoom from state to county to Census tract to block group, switch between 83 layers, and see live counts of the leads available in each area.
Screenshots
What It Does
- →83 layers: Medicare Advantage share, residents 65+, income, retirement income, housing, CDC health measures, FEMA hazard risk, and more
- →Neighborhood detail: 390 counties, 16,877 Census tracts, and 47,390 block groups, colored live as you zoom
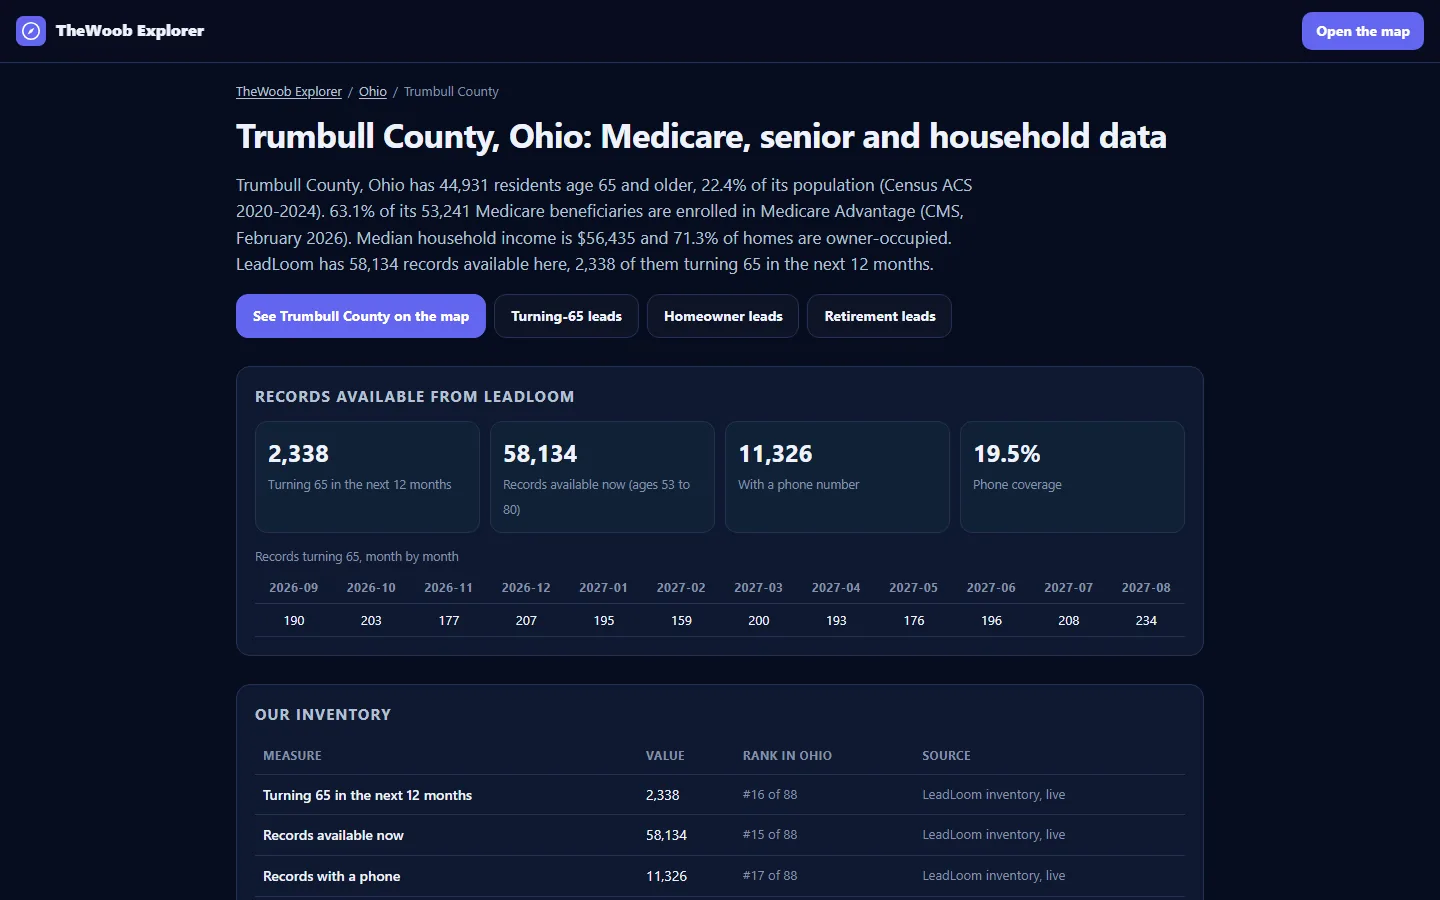
- →Live inventory: turning-65 counts by month, available records, and phone coverage down to the neighborhood, matching the stores to the record
- →Built for phones too: a full-screen map with a drag-up panel and search for any county or city
What I Built
- →One layer registry drives everything: a build step bakes published statistics for every county, tract, and block group, and the live app adds sold-aware inventory counts
- →Own-the-stack mapping: no third-party map tiles or APIs at view time, with geometry and data served from its own host
- →Citable by design: a plain-HTML page for every state and county, structured dataset markup, an OpenAPI description, and an llms.txt so AI assistants quote it accurately
- →Honest gaps: layers a publisher doesn't cover are labeled as such, never filled with guesses